Tabular data, instructions and documentation part 2
Documentation through publisher tools, e g Affinity Publisher
E g Affinity Publisher makes it easy to design and layout pages.
It is also easy to start with tabular data from a spreadsheet (Excel or CSV-file). The end-result is often a PDF-file.
Operationally, clear documentation is needed for the users to get things done.
The simple parts to get the documentation done are: It easy to produce these old and simple things together.
- Automation
- Data Merge
- CSV-files
- Place images
- Quick grids
- Handling pages, master pages or individual pages
- importing DWG-files if necessary. If you need drawings.
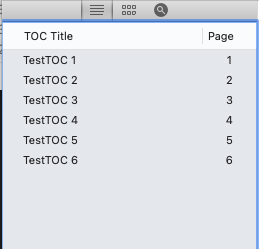
- Table of contents and/or bookmark
- Index
- Graphs
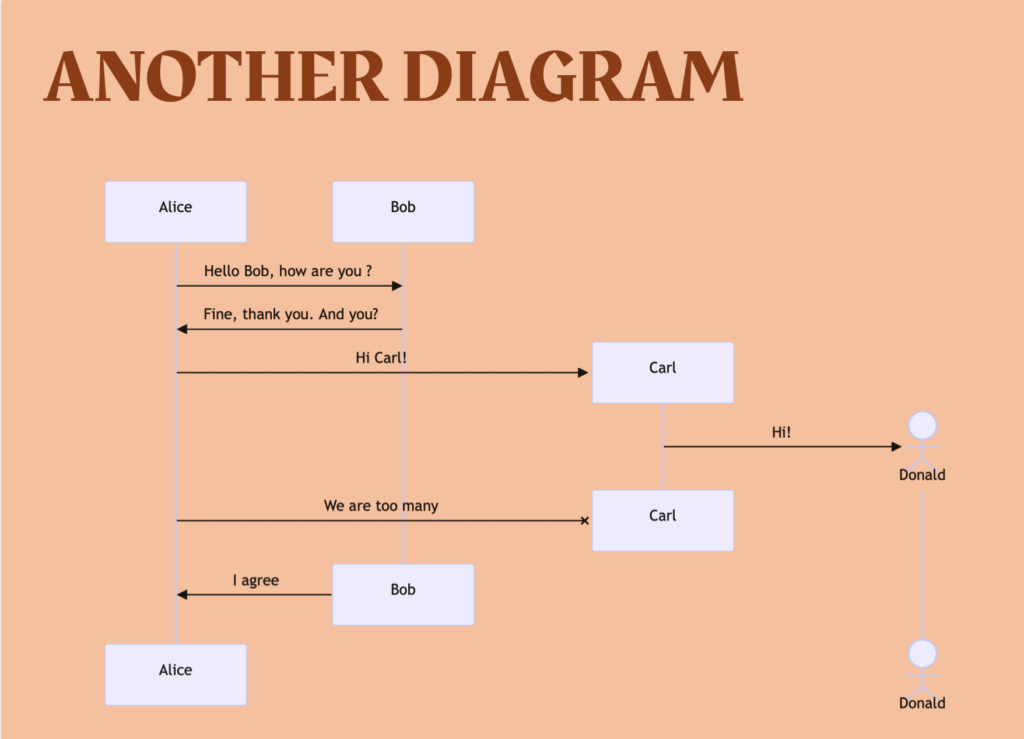
- Flow chart
- Math formulas
It is easy to handle a couple of hundreds of records and customize individual records when needed. Often what
is stored in a spreadsheet or/and in an image folder.
Images from Affinity Publisher below:
Place images
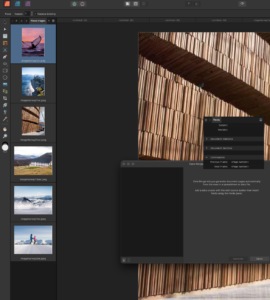
Data merge manager

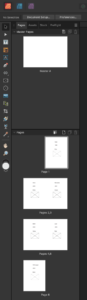
Master and page handling
Different charts
Math formulas

Markdown and Deckset
One other fast way to produce documentation is to use Markdown in e g Visual Studio Code and
then produce slides through Deckset.